Compressive strength is the number that decides whether a concrete mix is safe to pour. but confirming it the traditional way means casting cylinders and crushing them after 28 days of curing. That wait stalls schedules and locks in a mix chosen weeks earlier. This project builds a machine-learning model that predicts 28-day strength directly from the mix design and curing age accurate enough to guide decisions before the lab results come back.
R² ≈ 0.93 variance explained · ±3.0 MPa typical error · 1,030 lab mixes analyzed · 13 features (8 raw + 5 domain-engineered)
H2: Why it matters
Predicting strength ahead of the lab result unlocks three concrete wins:
- Quality control — estimate strength on day 1 and flag a weak batch before it is poured, instead of finding out 28 days later.
- Cost and carbon — cement is the most expensive and most carbon-intensive ingredient. The model lets you search for leaner mixes that still hit the target strength.
- Mix design — replace trial-and-error batching with data-driven optimization.
H2: The data
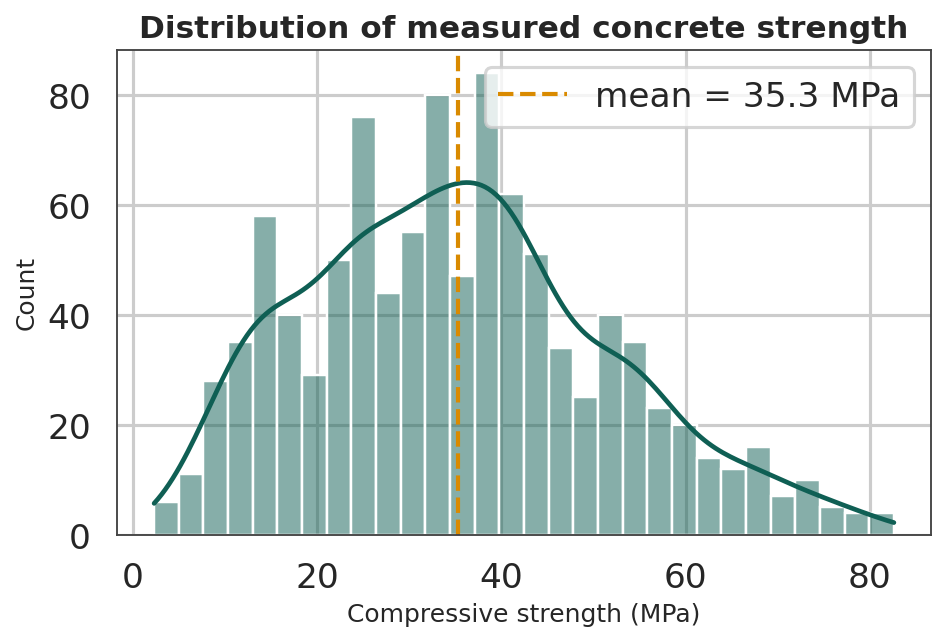
The analysis uses 1,030 laboratory concrete mixes (I-Cheng Yeh, UCI Machine Learning Repository, CC BY 4.0): cement, blast-furnace slag, fly ash, water, superplasticizer, coarse and fine aggregate, and curing age with measured compressive strength in MPa. The data was complete but contained 25 duplicate mixes, which were removed so identical rows could not leak across the train–test split. Measured strength spans lightweight fill to high-performance concrete.
H2: Materials knowledge, encoded as features
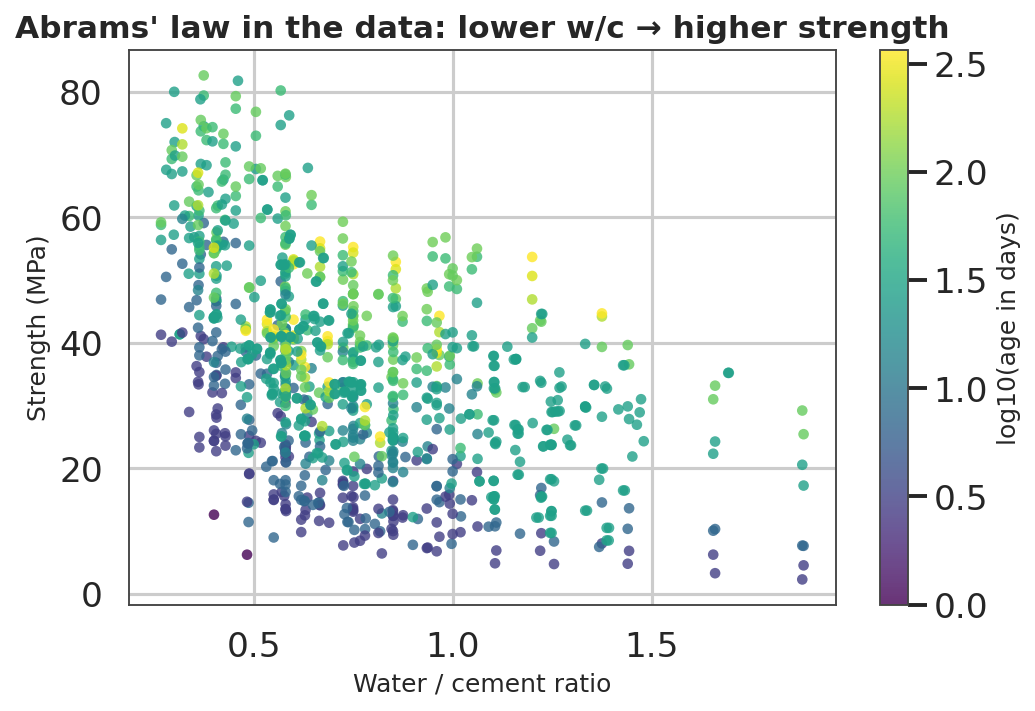
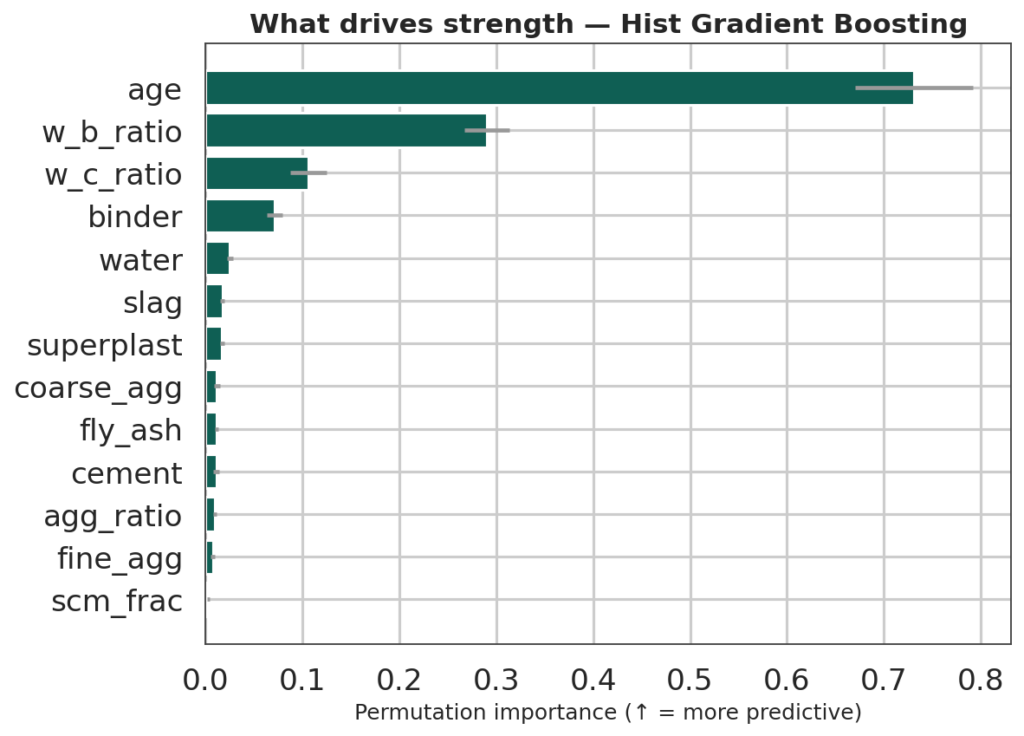
The decisive step is translating materials science into inputs the model can use. From the raw quantities I derived the water/cement and water/binder ratios (the classic and SCM-aware forms of Abrams’ law), total binder content, and the supplementary- materials fraction. These are the levers an engineer actually turns and, as the next section shows, they are exactly what the model relies on most.
H2: Model performance
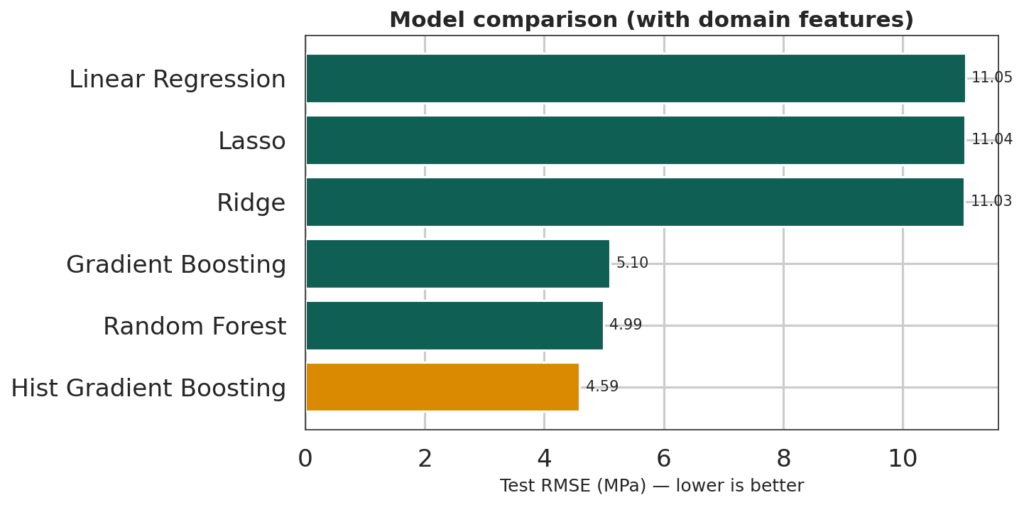
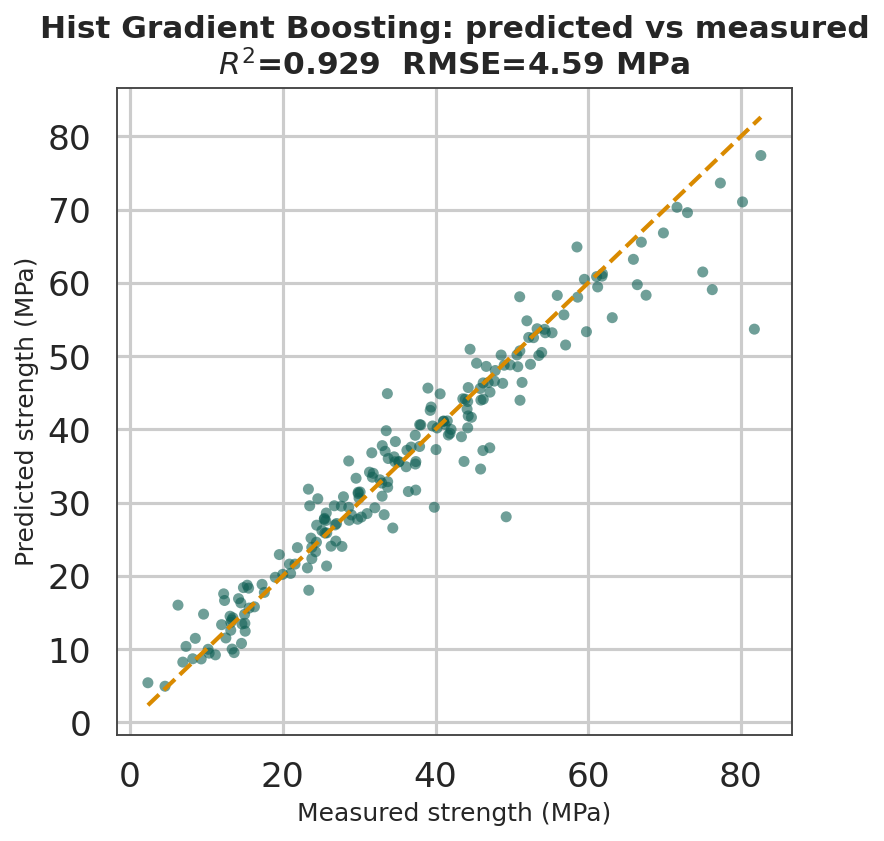
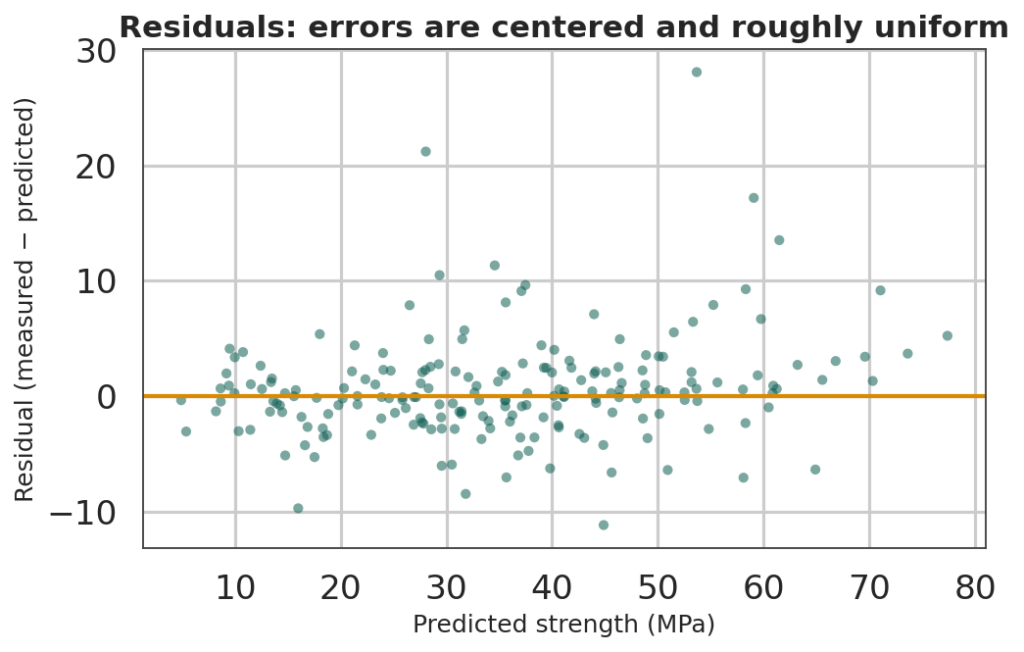
Six models were compared with 5-fold cross-validation and a held-out test set. Linear models plateau near R² ≈ 0.59 — strength is too nonlinear for them. Tree ensembles capture the interactions and reach R² ≈ 0.91–0.93. The best model predicts strength with a typical error of about ±3 MPa across a 2–83 MPa range, with unbiased residuals.
H2: What drives strength
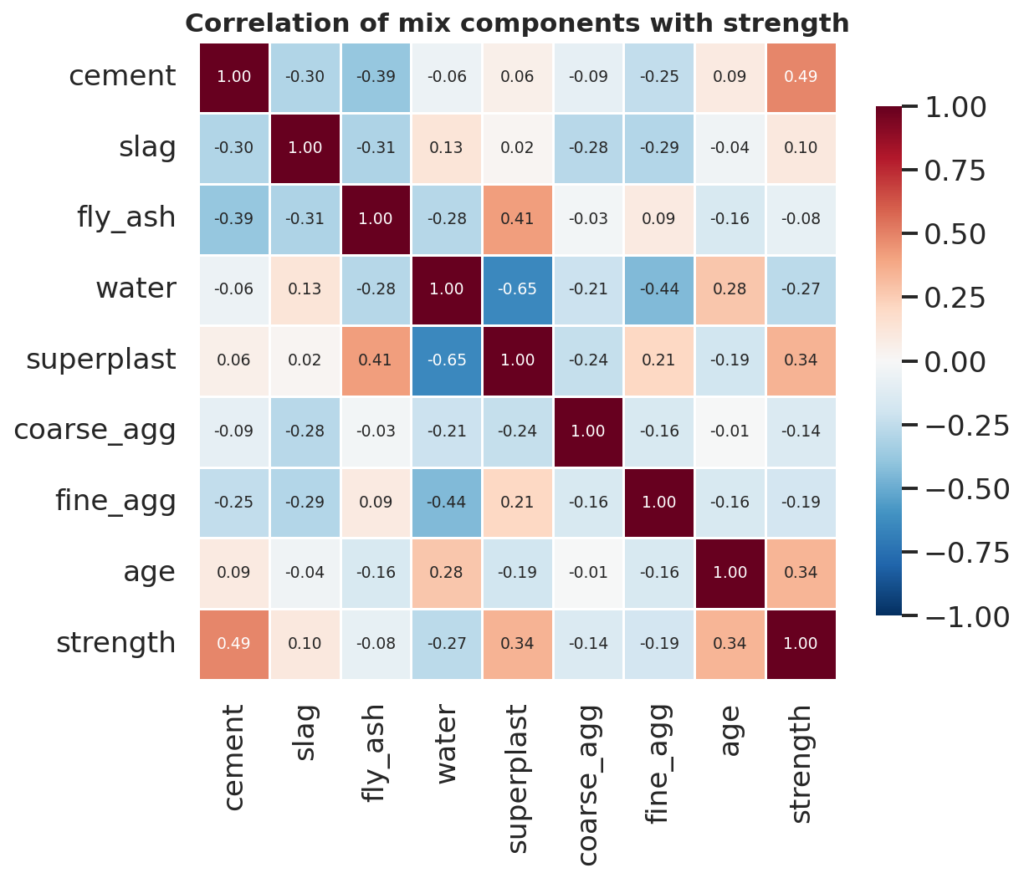
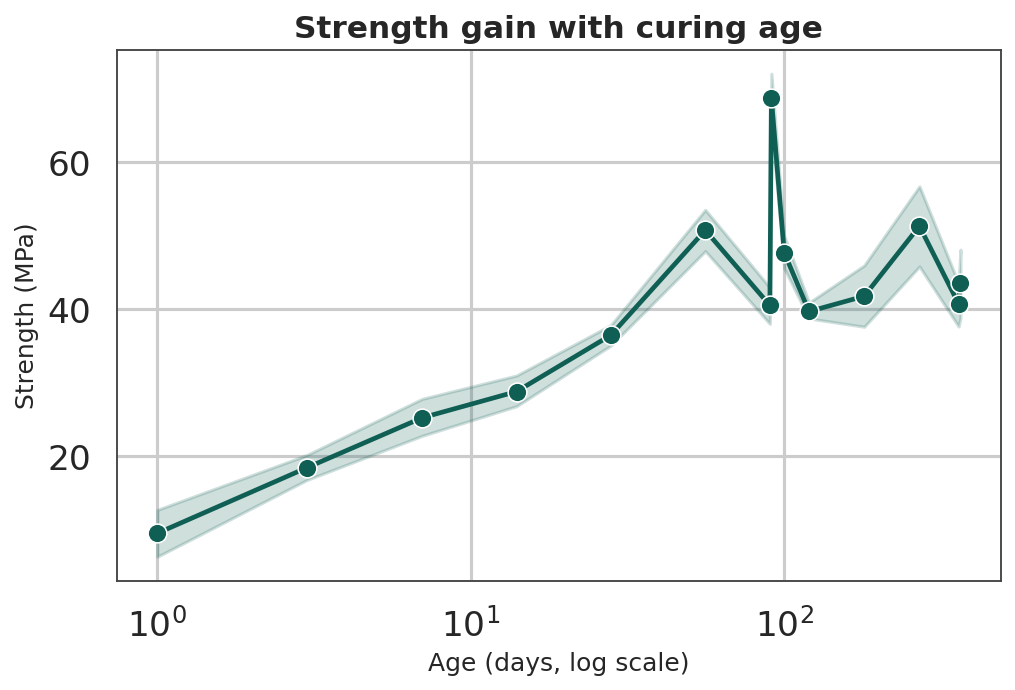
The model leans hardest on curing age and on the water/binder and water/cement ratios — two features that do not exist in the raw data and were engineered from domain knowledge. The physics that governs concrete is the same signal the algorithm finds most useful: materials expertise and machine learning point to the same answer.
H2: Business value & next steps
From a mix design and an age, the model predicts 28-day compressive strength within about ±3 MPa — accurate enough to support same-day quality-control decisions, cement-reduction studies, and data-driven mix optimization. Natural extensions include a mix optimizer (“the cheapest mix that still reaches 35 MPa at 28 days”), per-prediction explanations (SHAP), and a small web tool that returns a predicted strength for any mix.
FOOTER LINE (Paragraph block, small text)
Prepared by [EKEN NGANDJUI] · EKEYA Global Holdings LLC — Engineering & Data Analytics. Data: I-Cheng Yeh, Concrete Compressive Strength, UCI Machine Learning Repository (CC BY 4.0).